That's the question that I want to investigate.
Without bothering to define quantitatively what a bull market is, it's intuitively clear that one began in March 2009, which was the bottom of the commodities/credit/equity crash which took place from roughly 2006 to 2009, and continued on until at least August 2015 - a period of approximately 6 years and 6 months.
 | |
| S&P500 Index Close Mar 2009 to October 2015 |
The first task is to break this down into successive phases.
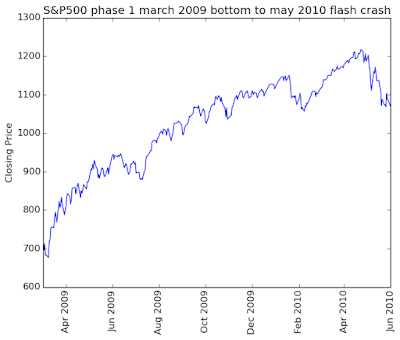
The first phase is probably best defined as the period from the March 2009 bottom to the May 2010 flash crash. This consists of 4 up waves, with the 3rd faltering, and the 4th terminating in the May 2010 flash crash.
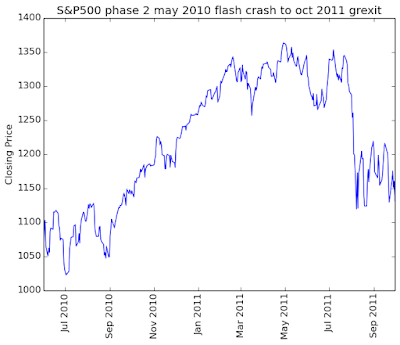
The next phase runs from the May 2010 flash crash, to the August 2011 greek euro exit related crash.
From the late 2011 GREXIT collapse, the price index exhibits 2 final bull waves, the first ending with 2012, and the second with a rather dramatic collapse around October 2014.
The final phase, it can be argued, is really more sidewise than directional, although overall still bullish, up until August 2015 - where a high volume crash is experienced.


